fig2c
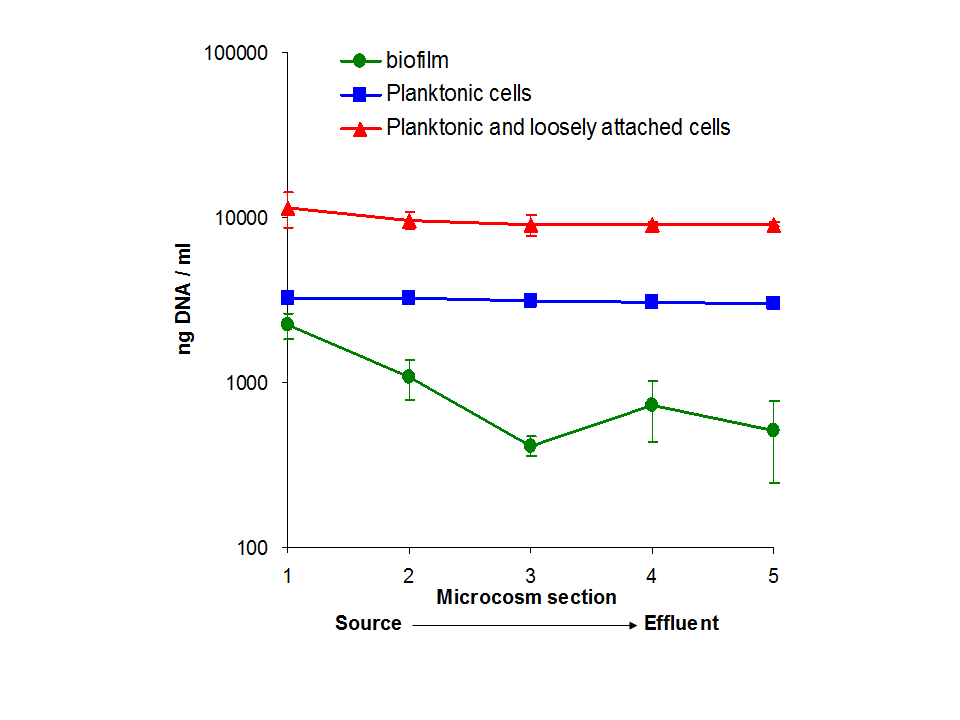
2C. DNA measurements from microcosms. Error bars indicate standard deviation of the mean from three replicate microcosms.
2C. DNA measurements from microcosms. Error bars indicate standard deviation of the mean from three replicate microcosms.